
Read phishing activity
When a client asks “how are our phishing tests going?”, Risk → Phishing is the answer. It’s the activity log of every phishing test we’ve sent to that client’s users — automatic rotation and on-demand sends, all in one place.
The page
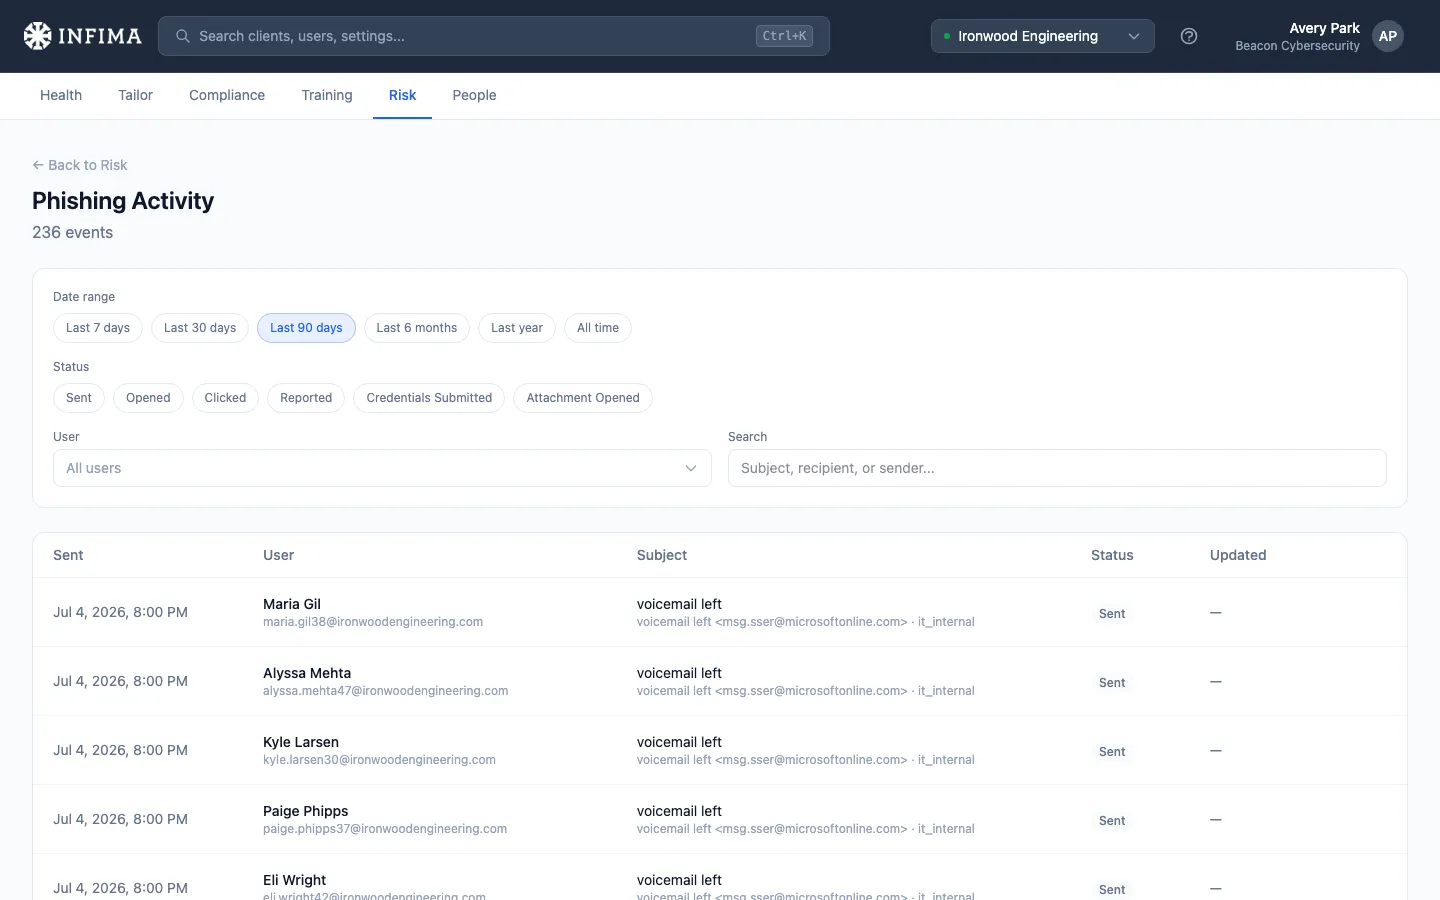
Section titled “The page”Open the client → Risk → Phishing. The page is built around three things: a counter at the top, a filter bar, and an event list.
The counter
Section titled “The counter”Shows the total events matching your current filters (default: last 90 days, all statuses, all users).
The filter bar
Section titled “The filter bar”- Date range — Last 30 days, Last 90 days (default), Last 6 months, Last year, All time.
- Status — chips for each status (see below). Click to filter; click again to remove. Multi-select.
- User — search by name or email, pick one user. Click Clear to reset.
- Clear filters appears whenever you’re not at defaults.
The event list
Section titled “The event list”One row per phishing test sent. Each row shows the user, the test’s subject, who it was “from,” sent timestamp, the current status, and when that status was reached. Click a row to drill into the individual result.
What each status means
Section titled “What each status means”Six statuses you’ll see, in roughly increasing severity:
- Sent — neutral. The test was delivered; the user hasn’t done anything yet.
- Opened — warning. The user opened the email but didn’t act on it.
- Clicked — danger. The user clicked a link in the test.
- Reported — success. The user clicked the Report Phishing button. This is the correct action and what you want to see.
- Credentials Submitted — danger. The user clicked through to the simulated phishing site and entered credentials. Worst outcome.
- Attachment Opened — danger. The user opened an attachment in an attachment-style test. Equivalent severity to Credentials Submitted.
Reported is the success state — it’s what training is for. A user reporting a test means they recognized it and used the right escape valve. Their result shows green.
A user can transition through multiple states for a single test — e.g., Sent → Opened → Clicked — and the status reflects the most recent thing they did.
Drilling into a single result
Section titled “Drilling into a single result”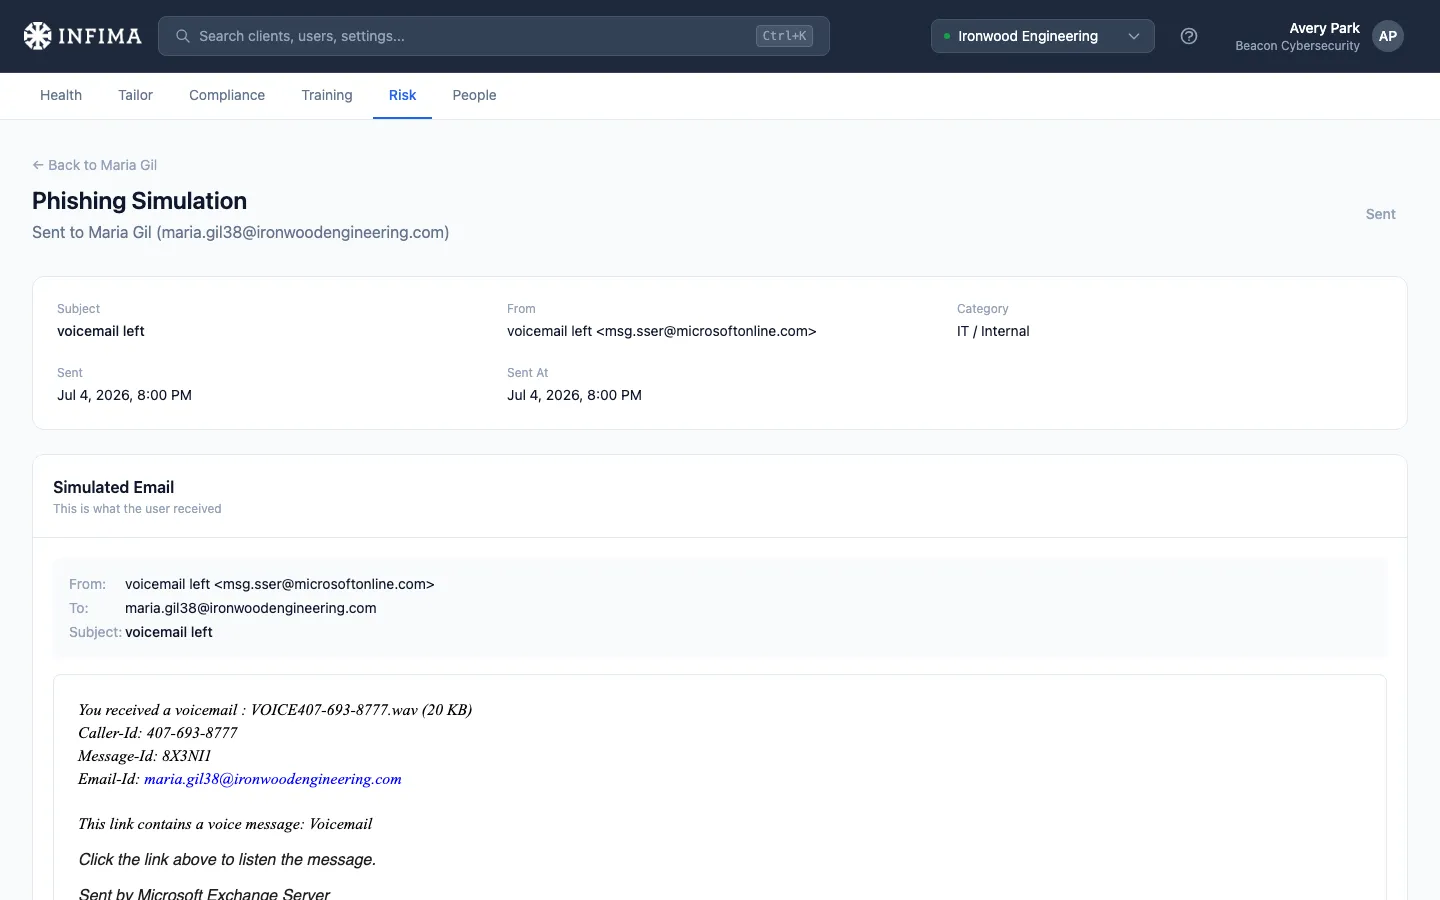
Click any row in the list. The detail page shows:
- The current status as a pill in the top-right.
- Subject, From, Category, Sent, Status At in a grid — same data as the list row, formatted for reading.
- Defensive behavior tested — the habit this test was built around (go direct, verify the sender, verify out-of-band, or skip unexpected attachments). Shown when the test is tagged with a behavior; absent for untagged tests. A small Uses urgency badge appears alongside it when the test leans on time pressure. See behavior-based remediation.
- Sender pretext — what kind of sender the test was impersonating (a service notification, an executive, an IT request, and so on). Shown when tagged.
- Language sent — Spanish or French (Canadian) when the user received a translated version. Absent when the test was sent in English.
- IP Address and User Agent — populated for statuses past Opened. Useful when investigating whether a click came from the user’s normal device or somewhere else.
- Simulated Email preview — the exact email the user saw (From/To/Subject + the rendered body). Helps you understand what they were looking at when they made their decision.
Reset Status (admin override)
Section titled “Reset Status (admin override)”When a user’s result lands on Clicked, Credentials Submitted, or Attachment Opened, a Reset Status button appears. Clicking it bumps the result back to Opened.
Use it when:
- A user demonstrably clicked by accident (a curious admin, a known-good keyboard misfire) and you don’t want it skewing their risk score.
- An automated security scanner pre-clicked the link before the real user saw it.
- An accidental click that the user immediately reported separately.
It does not un-send the test, change the user’s training, or affect anyone else. It’s purely a status correction.
You’ll know what you’re looking at when
Section titled “You’ll know what you’re looking at when”- The counter matches your filter selection (try Clicked + Last 30 days to verify).
- Click into a single row and you see the original email rendered in the preview pane.
- A user’s risk score on the parent Risk page reflects the activity you see here.
Frequently asked
Section titled “Frequently asked”Why is a user showing as Reported on a test they shouldn’t have known was a test? That’s expected — the user recognized the email as suspicious and clicked the Report Phishing button. They weren’t supposed to know it was a test; they were supposed to handle it correctly, and reporting is the correct handling. The Reported status is the success state.
The status reads Sent but the test was sent days ago. Is something wrong? Sent means delivered but the user hasn’t interacted with it — they haven’t opened, clicked, or reported. Either it’s still sitting in their inbox or (more often) they’ve ignored it. Some users genuinely never read their email; others may have filed it as junk. Sent itself isn’t bad data; the user just hasn’t engaged.
Where do I see what an individual user did across all their tests? Risk → User, click the user, scroll to their phishing history. That’s the per-user feed (same drilldown links into individual results). The Activity page is for the client-wide view; the user page is for one person’s history.
I just sent an on-demand test and it’s not showing up. It takes a moment for the send to flow through. Refresh the page after a minute. If it still doesn’t appear, the recipients may have been skipped — see Send a phishing test on demand for the skip rules.
Can I export this data? The activity log itself isn’t directly exportable from this page today. The reporting product (see Scheduled reports and Custom reports) covers the partner/client-share use case.
Where do I see behavior breakdowns across all my clients? Settings → Phishing has cross-client cards for behavior coverage, remediation completion, urgency exploitation, and sender pretext. See behavior-based remediation for what each card shows.
Related
Section titled “Related”- Phishing templates — choose which tests are eligible for the client.
- Behavior-based remediation — what the Defensive behavior tested field on a result detail page is tied to.
- Send a phishing test on demand — when you need to push a specific test outside the rotation.
- Report Phishing button — the user-side action that lands a test on the Reported success state.